Lab 02: Data and Reproducible Workflow
Week 5
Sep 17, 2025
The perils of bad data cleaning
Published in the American Economic Review (2007):
The perils of bad data cleaning
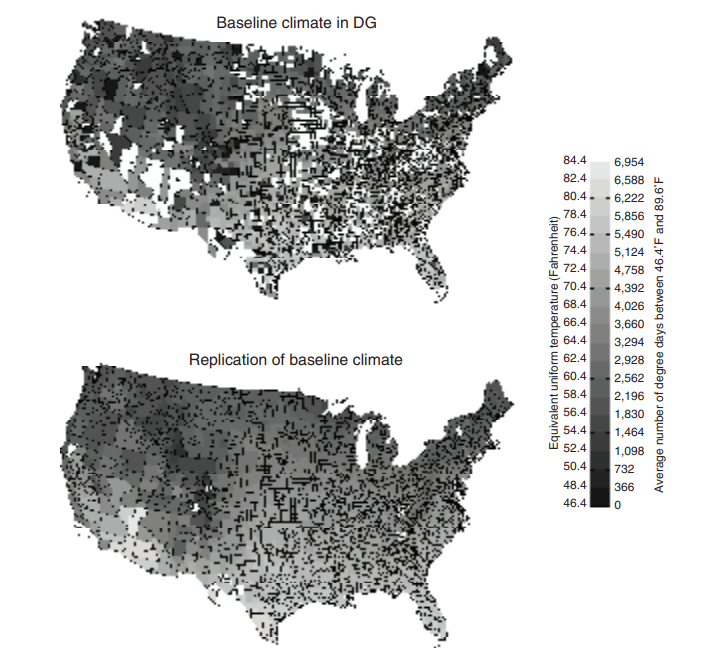
DG’s baseline climate measure (dd89_7000) has a value of zero degree days for 163 counties. If correct, this measure implies temperatures do not exceed 8°C (46.4°F) in those counties during the growing season of April through September. Temperatures this low would seem implausible in any state, yet many of these counties are in warm southern states such as Texas.
The perils of bad data cleaning
The perils of bad data cleaning
Contrary to the results in DG (2007), the corrected data suggest that an immediate shift to the projected end-of-the-century climate would reduce agricultural profits.
Another example
Originally reported “the intervention, compared with usual care, resulted in a fewer number of mean COPD-related hospitalizations and emergency department visits at 6 months per participant.”
There were actually more COPD-related hospitalizations and emergency department visits in the intervention group compared to the control group
Mixed up the intervention vs. control group using “0/1” coding
R and RStudio
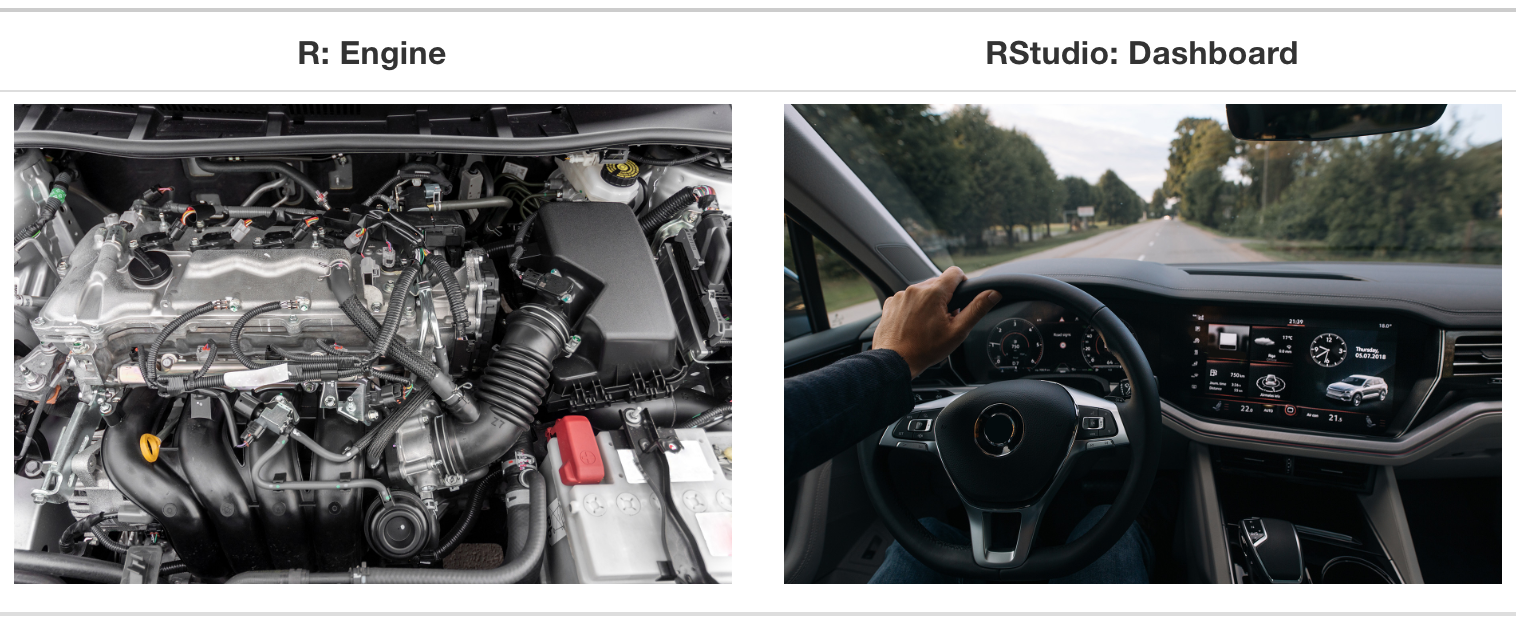
R is a statistical programming language
RStudio is a convenient interface for R (an integrated development environment, IDE)
Source: Statistical Inference via Data Science
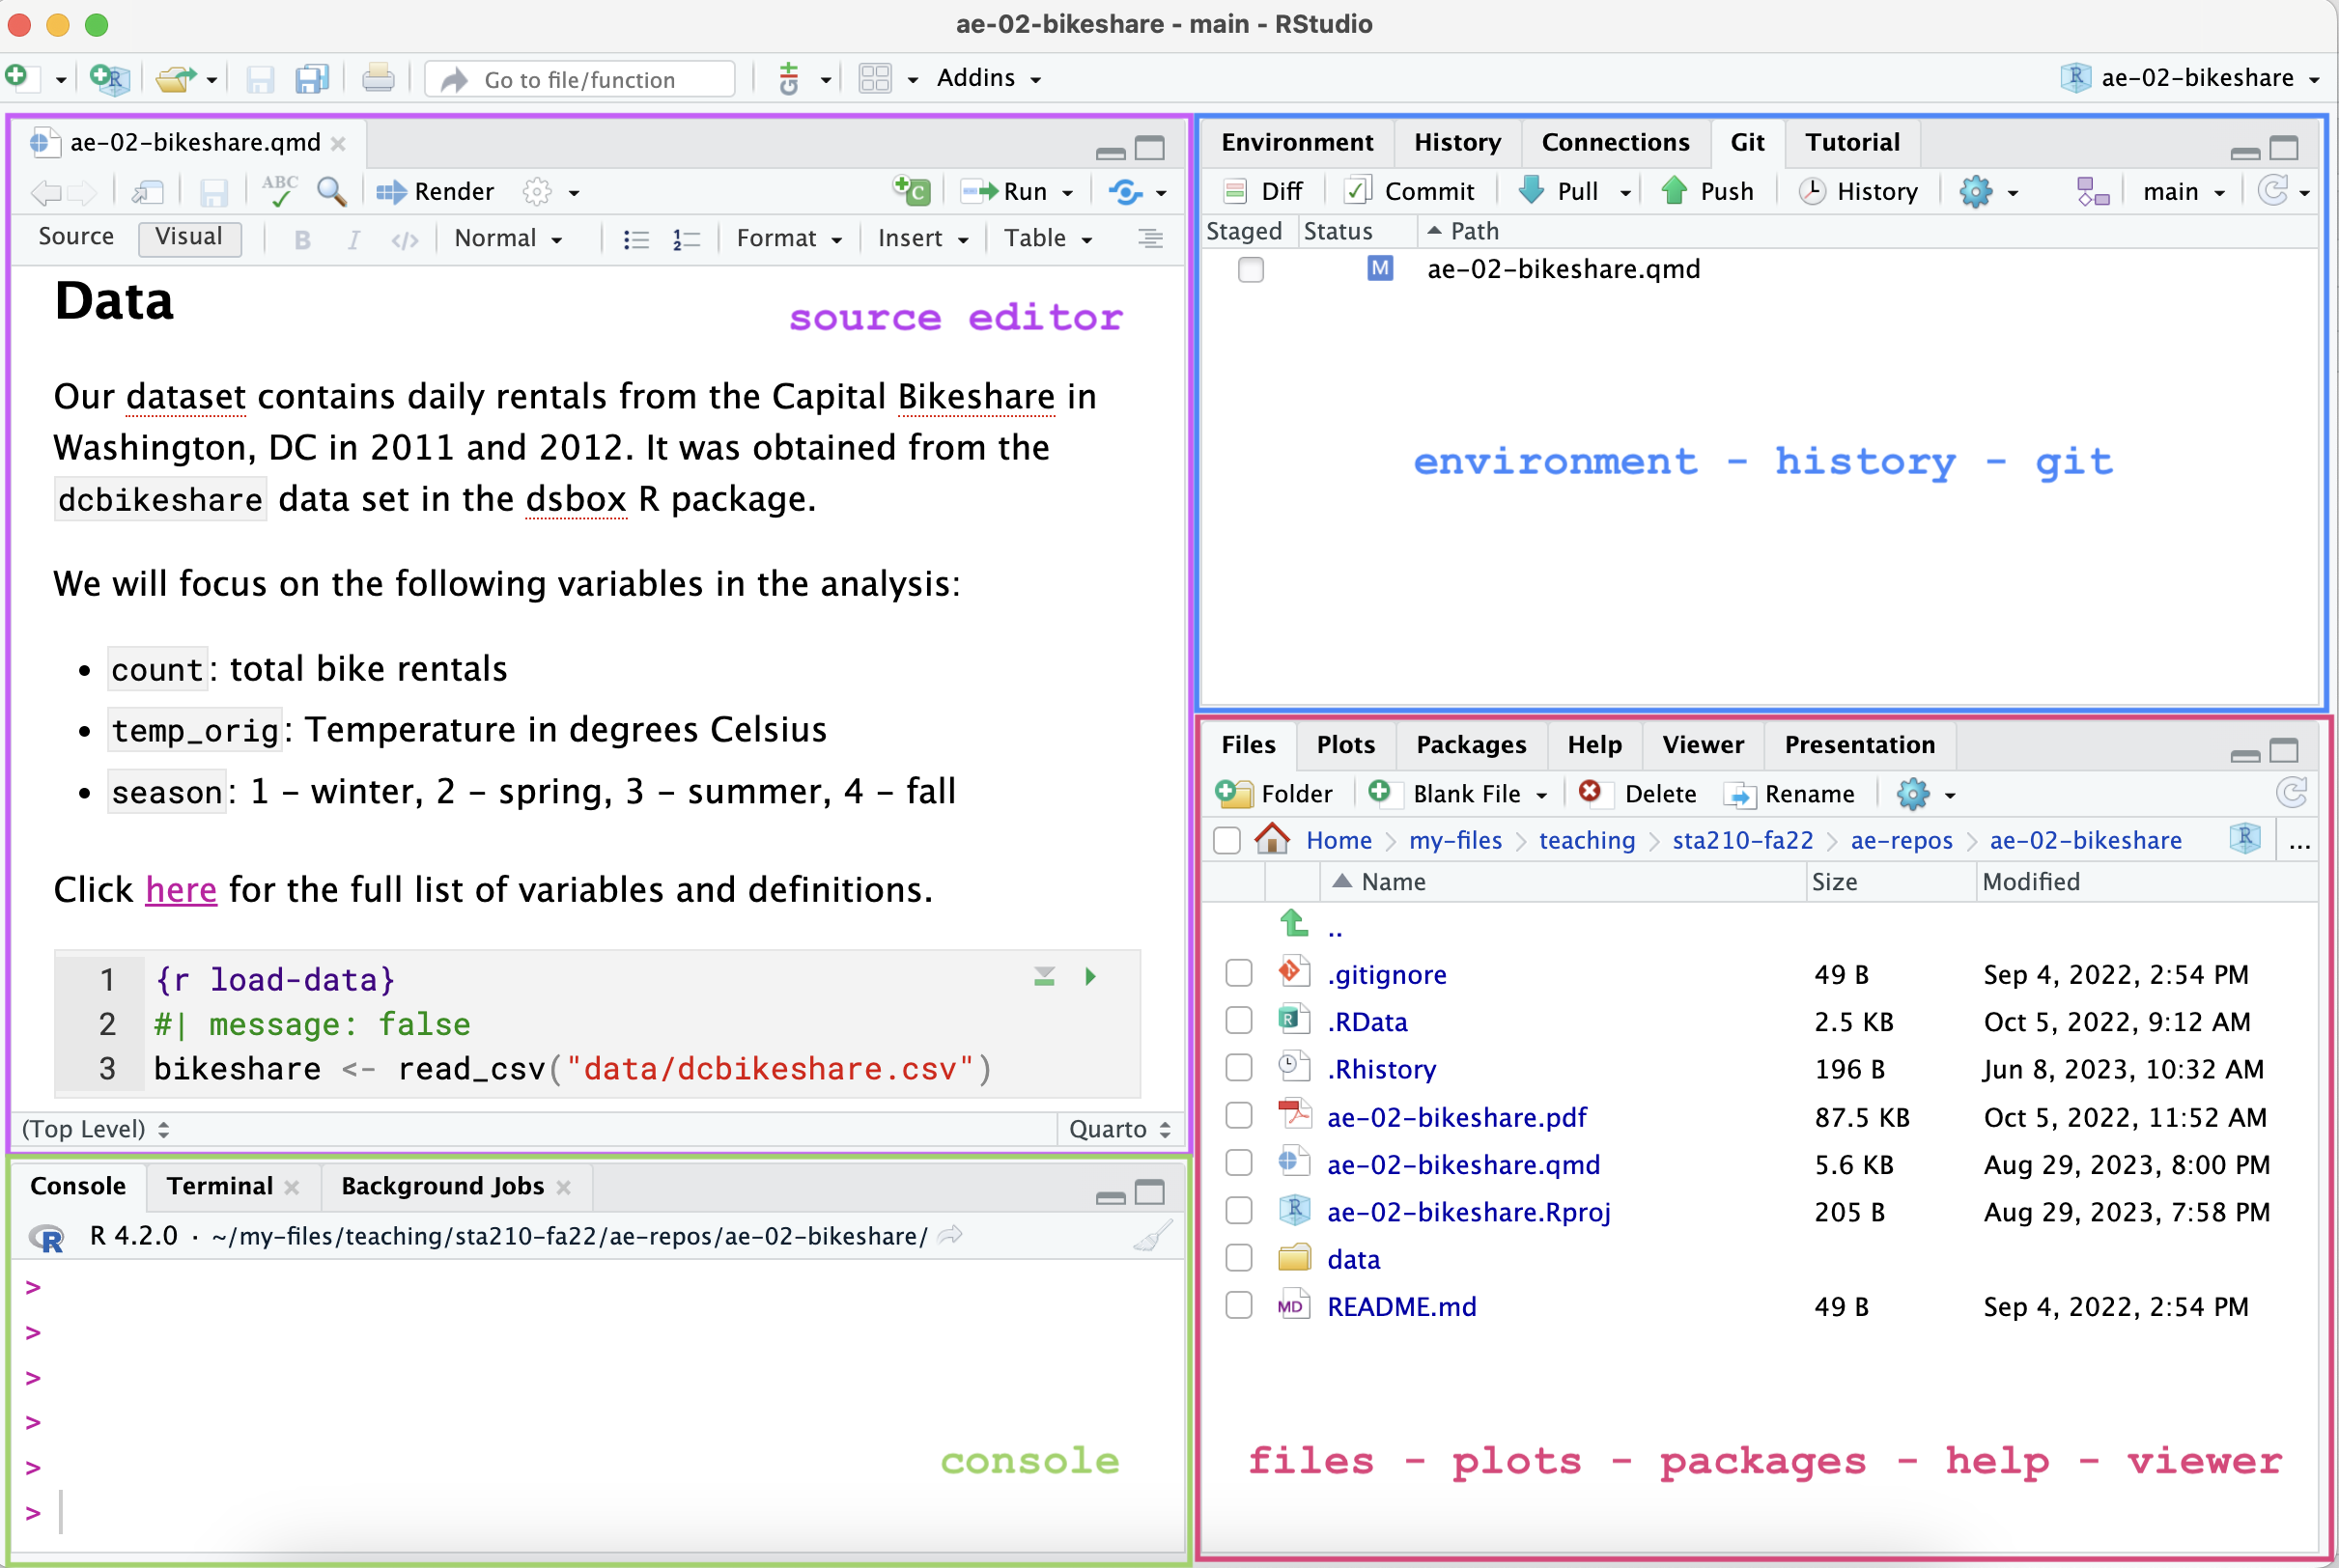
RStudio IDE
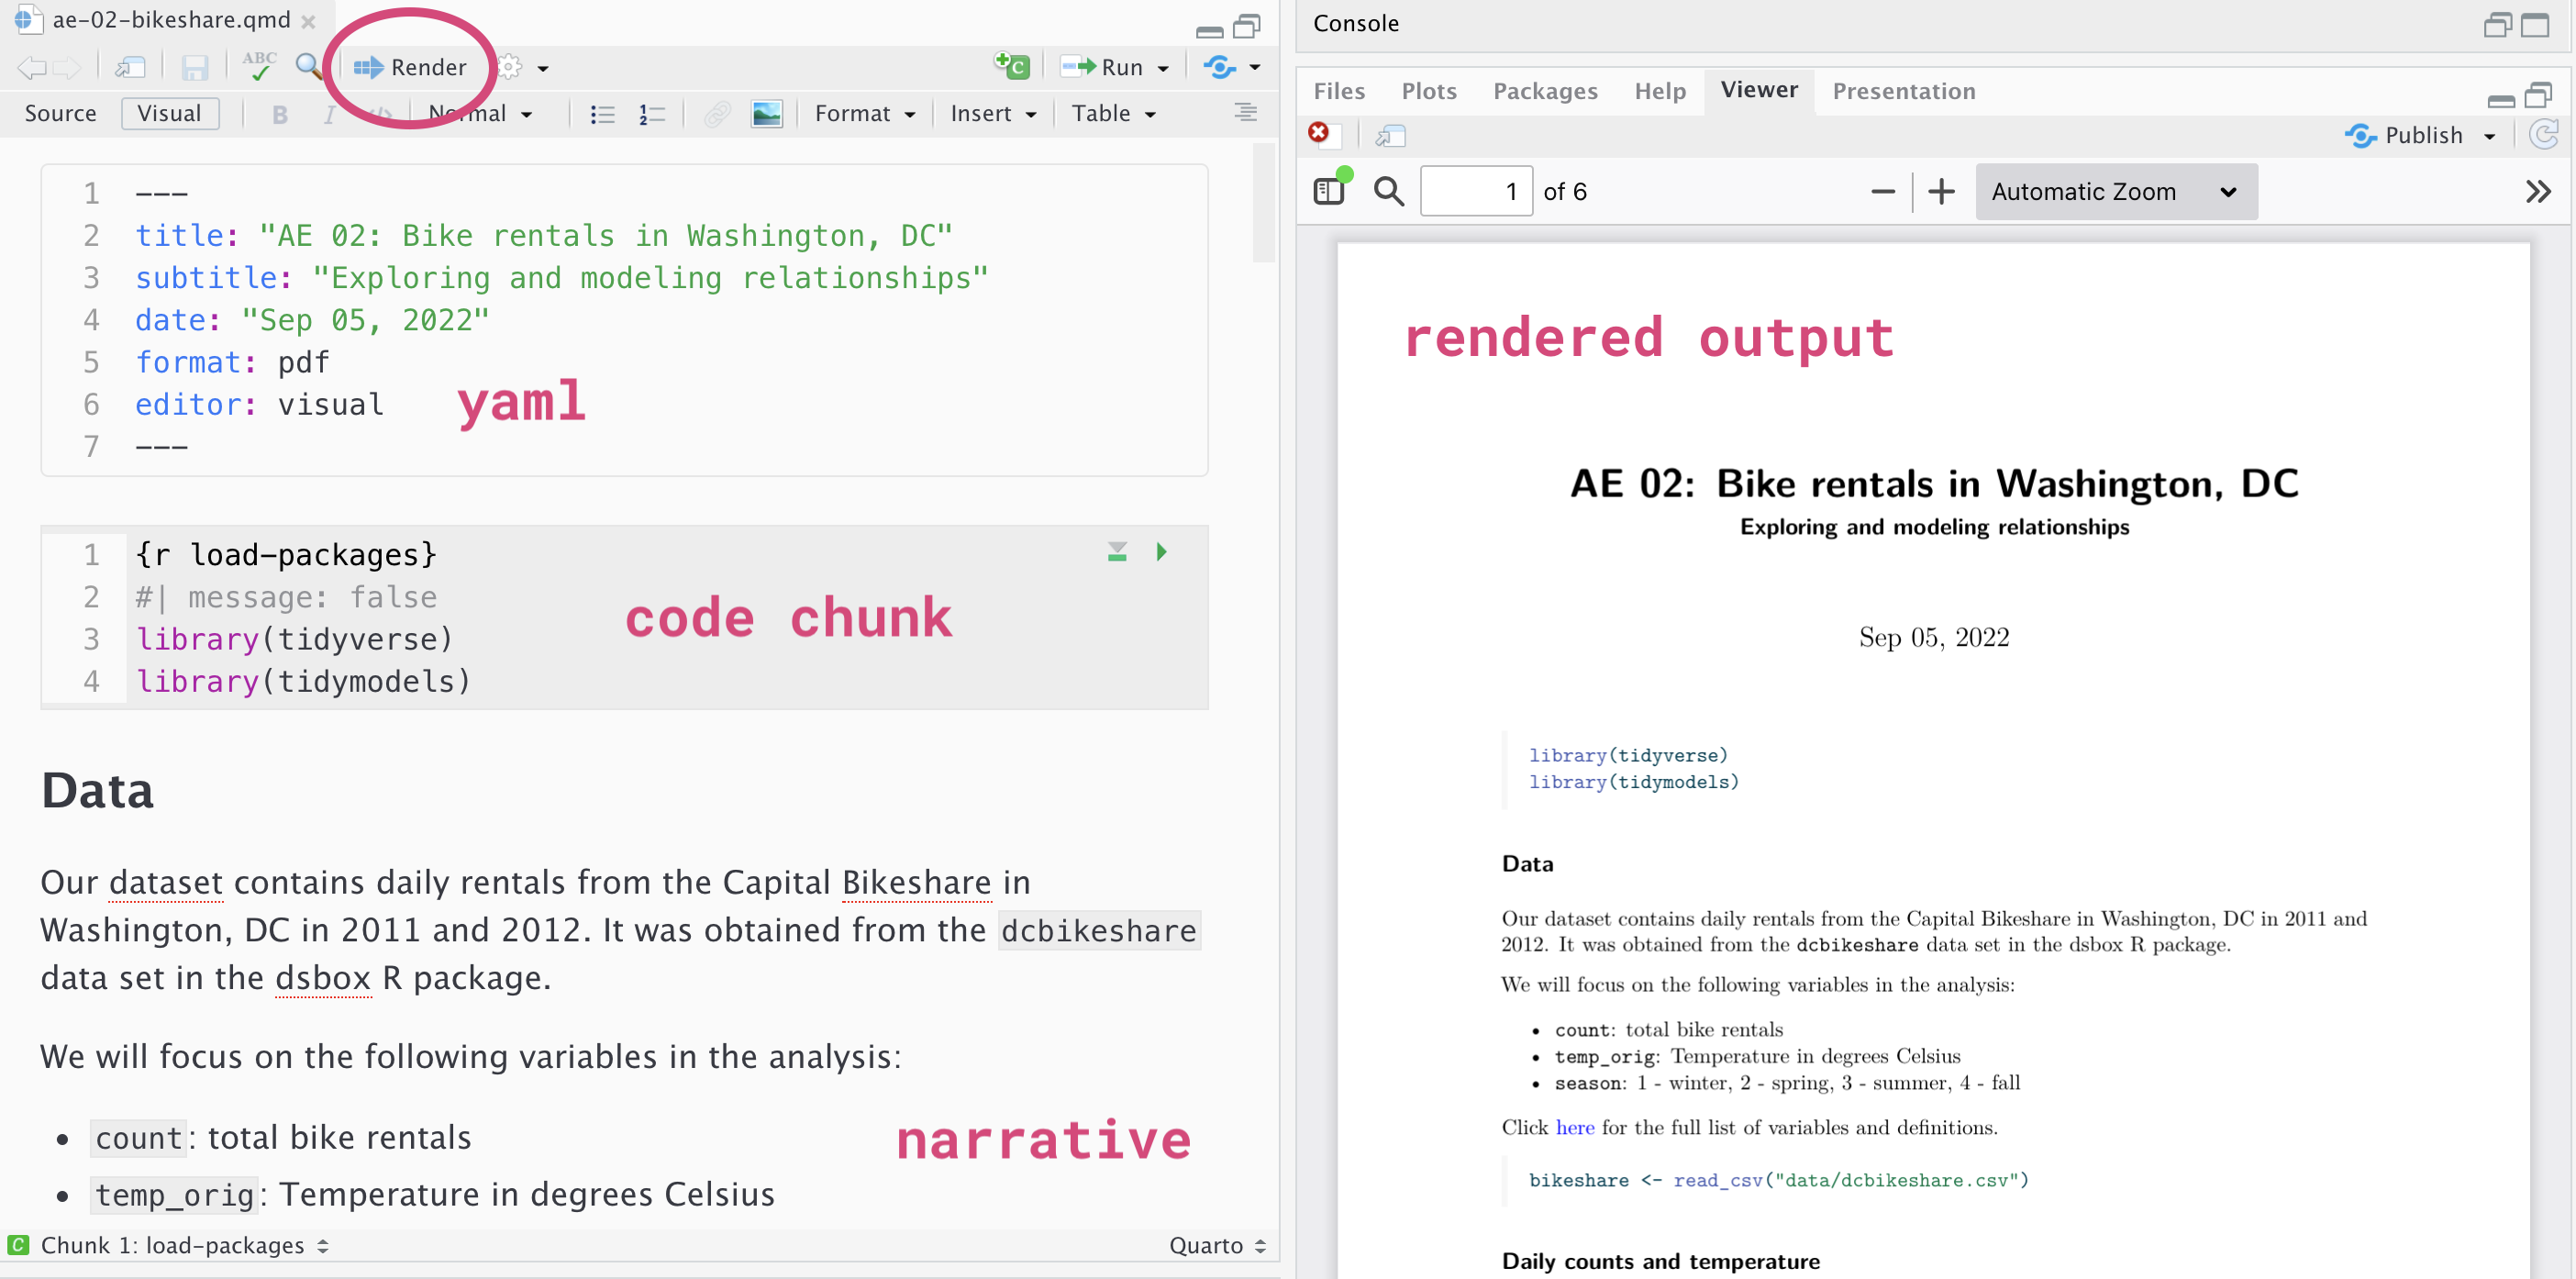
Quarto
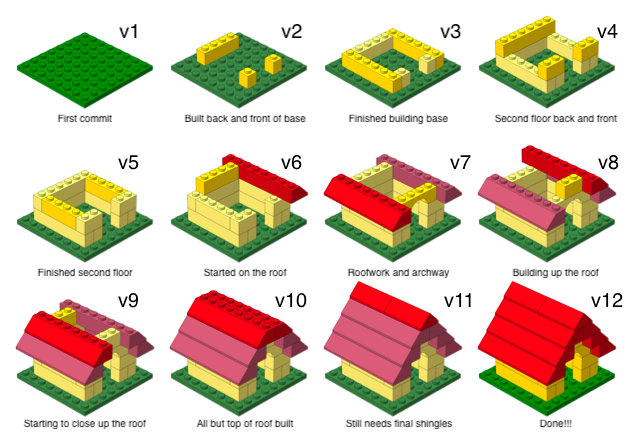
What is versioning?

What is versioning?
with human readable messages
Why do we need version control?
Provides a clear record of how the analysis methods evolved. This makes analysis auditable and thus more trustworthy and reliable. (Ostblom and Timbers 2022)
git and GitHub
- git is a version control system – like “Track Changes” features from Microsoft Word.
- GitHub is the home for your git-based projects on the internet (like DropBox but much better).
- There are a lot of git commands and very few people know them all. 99% of the time you will use git to add, commit, push, and pull.
Caveat
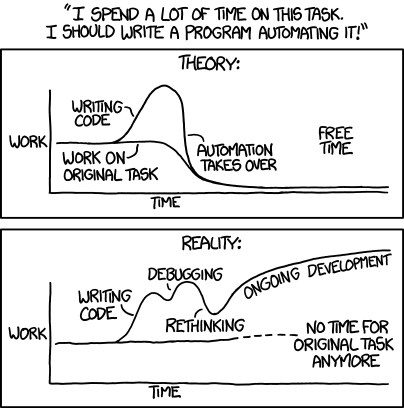
Image from xkcd (source)