and thus there are \(Q=3\) restrictions.
The alternative hypothesis is:
\[H_1: \text{At least one of these equalities does not hold.}\]
The Wald Test Statistic
The Wald statistic provides a general method for testing multiple restrictions.
It compares how far the estimated parameters deviate from the restrictions, relative to sampling uncertainty:
\[
W = (R\hat{\theta} - c)' [R\widehat{Var}(\hat{\theta})R']^{-1} (R\hat{\theta} - c)
\]
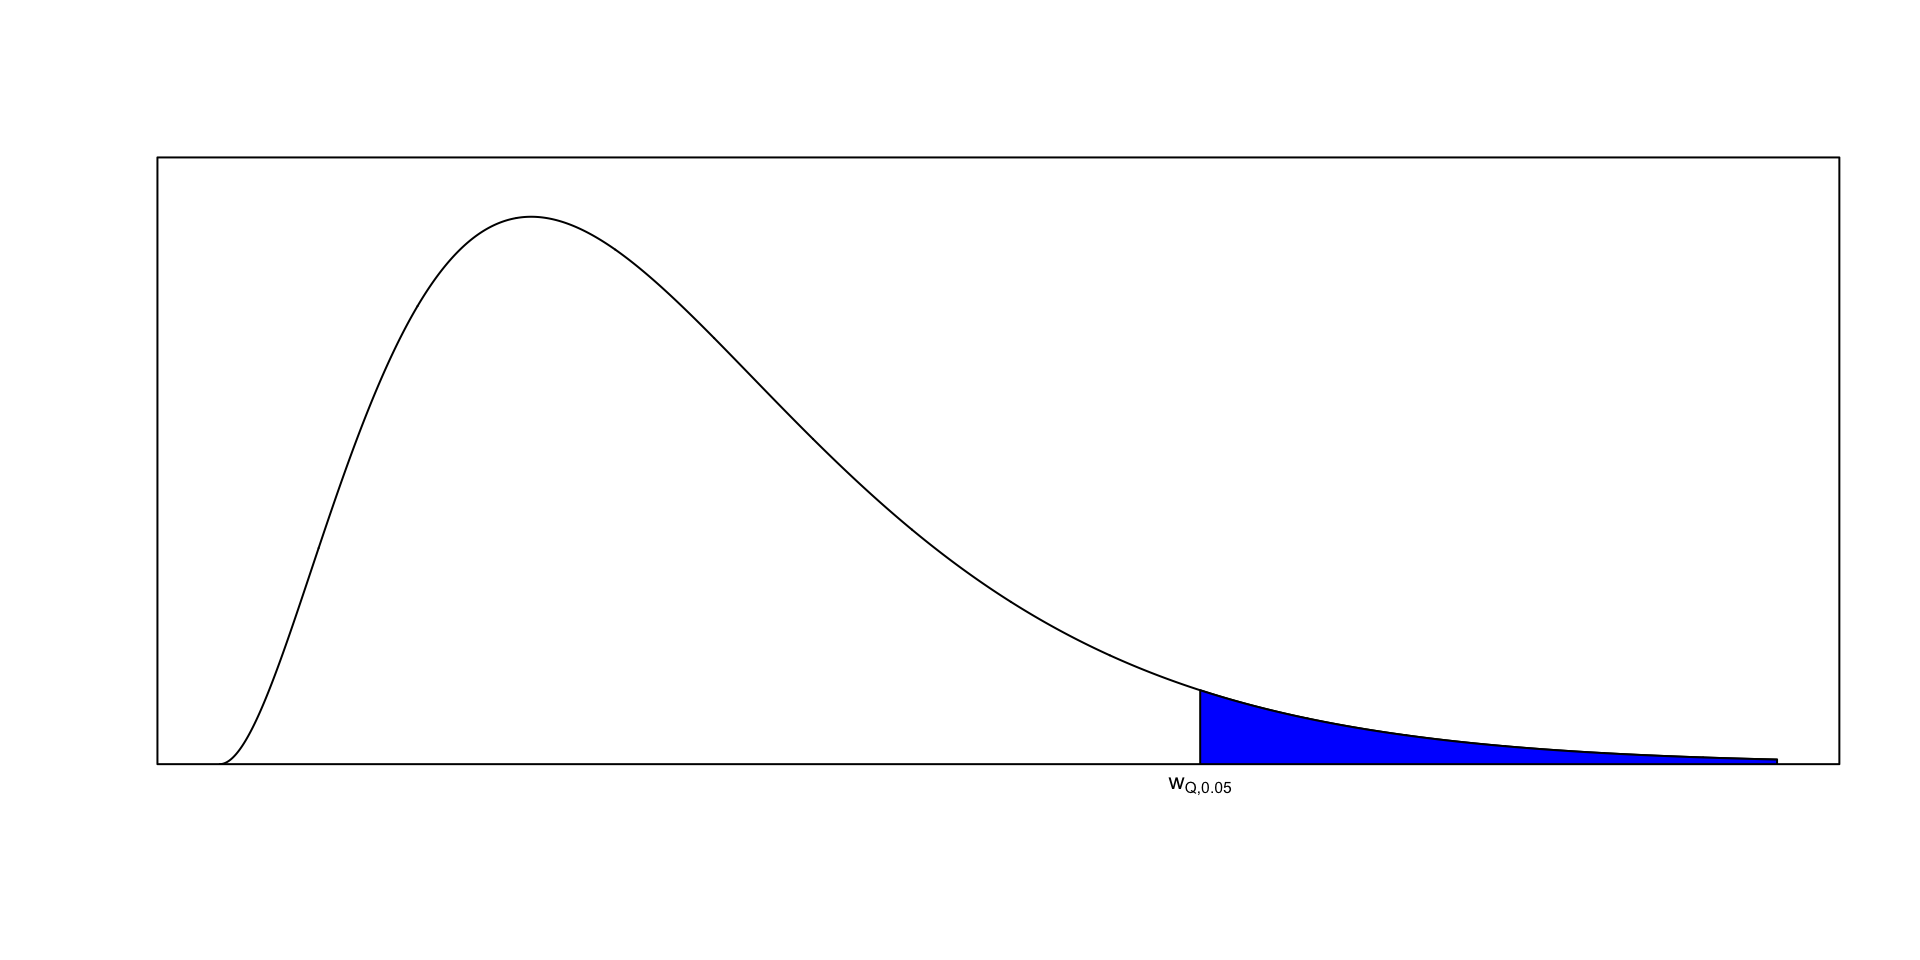
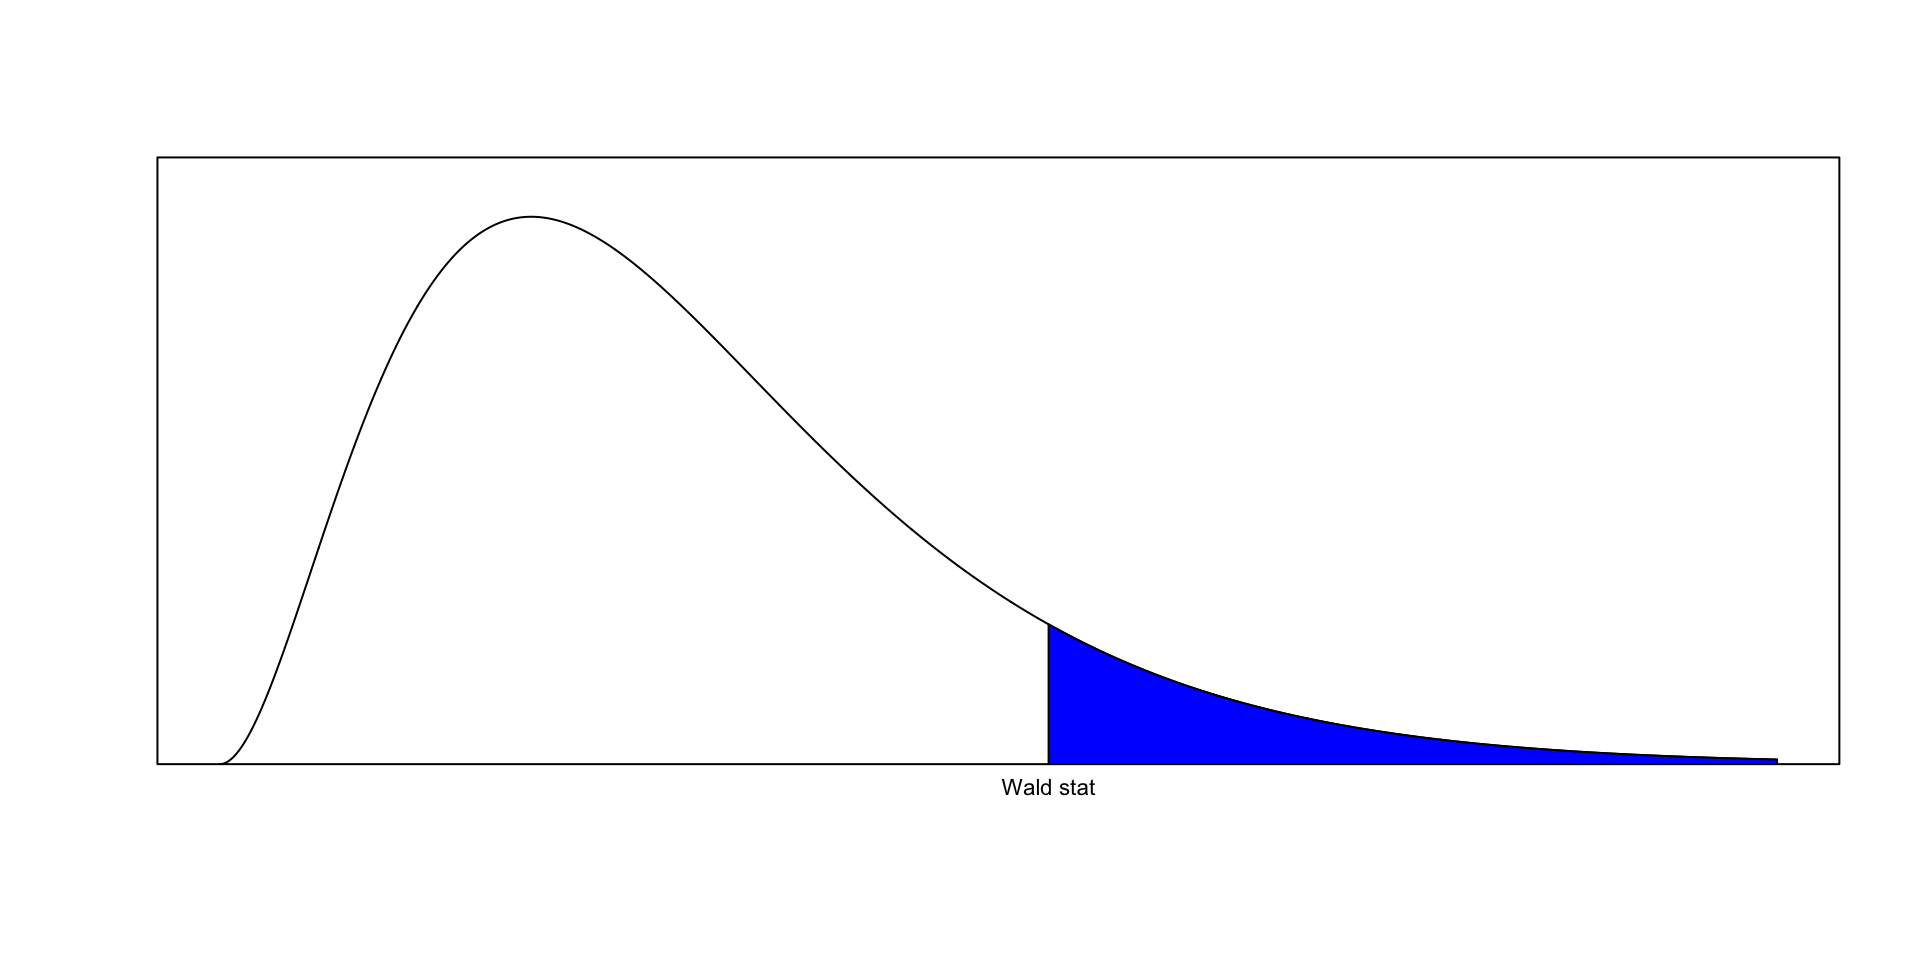
Under \(H_0\), \(W \sim \chi^2_Q\) approximately.
If \(W\) exceeds the \(1-\alpha\) quantile of \(\chi^2_Q\), we reject \(H_0\).
Rejection rule based on Wald statistic (test at \(\alpha\)-level)
Reject \(H_0\) if \(W > \chi^2_{Q,1-\alpha}\) or if p-value\(<\alpha\)
Do not reject \(H_0\) if \(W \leq \chi^2_{Q,1-\alpha}\) or if p-value\(>\alpha\)
Rejection area for Wald test
P-value of a Wald test
CPS Example: Comparing Group Means
Check Your Understanding
Question: Suppose we only compare the first three groups: Married, Divorced, and Widowed.
Write the null hypothesis in the form \(H_0: R\theta = c\).
Identify how many restrictions (\(Q\)) there are.
Sketch or describe the shape of the rejection region in \((\mu_M, \mu_D, \mu_W)\) space.
Tip
Hint: You should find two independent restrictions when testing equality across three means.
Check Your Understanding
We use the CPS dataset from probstats4econ.
Suppose we want to test whether average weekly earnings (\(earnwk\)) are the same across four marital status groups.
# A tibble: 4 × 5
  marstatus     mean_earn sd_earn     n    se
  <fct>             <dbl>   <dbl> <int> <dbl>
1 Divorced           902.    714.   707  26.9
2 Married           1047.    782.  2377  16.0
3 Never married      821.    664.   853  22.8
4 Widowed            661.    327.    76  37.5
Computing the Wald Statistic
We compute the vector of sample mean differences: \[
\hat{\theta} = (\bar{Y}_M - \bar{Y}_D, \; \bar{Y}_D - \bar{Y}_W, \; \bar{Y}_W - \bar{Y}_N)'
\]
and estimate its covariance matrix using the standard errors from each group mean.
Computing the Wald Statistic
# Helper functions for Wald and variance estimationwald_test <-function(gamma_hat, var_gamma_hat, R =diag(length(gamma_hat)), r =rep(0, length(gamma_hat))) {if (!is.matrix(R)) R <-t(as.matrix(R)) W <-t(R %*% gamma_hat - r) %*%solve(R %*% var_gamma_hat %*%t(R)) %*% (R %*% gamma_hat - r) W <-as.numeric(W) p_value <-1-pchisq(W, nrow(R))return(list(W = W, p_value = p_value))}var_mean_indep <-function(x_vectors) { num_means <-length(x_vectors) tempvec <-rep(0, num_means)for (i in1:num_means) { tempvec[i] <-var(x_vectors[[i]]) /length(x_vectors[[i]]) } var_mean <-diag(tempvec)return(var_mean)}
Computing the Wald Statistic
# Prepare group datacpsemployed<-cps%>%filter(lfstatus=="Employed")# construct the four subsamples based on marital statussample_m <- cpsemployed[cpsemployed$marstatus=="Married",]$earnwksample_d <- cpsemployed[cpsemployed$marstatus=="Divorced",]$earnwksample_w <- cpsemployed[cpsemployed$marstatus=="Widowed",]$earnwksample_n <- cpsemployed[cpsemployed$marstatus=="Never married",]$earnwk# create a vector of the sample mean estimatesgamma_hat <-c(mean(sample_m),mean(sample_d),mean(sample_w),mean(sample_n))# calculate the estimated asymptotic variance matrixvar_hat <-var_mean_indep(list(sample_m,sample_d,sample_w,sample_n))gamma_hat
Task:
Consider the hypothesis: \[H_0: \mu_A = \mu_B = \mu_C\]
Express this as a system of equalities involving mean differences.
Write down the corresponding restriction matrix \(R\) if we order the means as \((\mu_A, \mu_B, \mu_C)\).
What is the dimension of \(R\)? How many restrictions are being tested?
Tip
Hint: You can express it as two differences: \((\mu_A - \mu_B)\) and \((\mu_B - \mu_C)\).
Mathematical Exercise 2
Task:
Suppose we have four parameters \(\theta_1, \theta_2, \theta_3, \theta_4\) and the null hypothesis: \[H_0: \theta_1 + \theta_2 = 0, \quad \theta_3 - \theta_4 = 0\]
Write this in the form \(R\theta = c\).
Identify the matrix \(R\) and the constant vector \(c\).
What is the number of restrictions (\(Q\))?
Tip
Hint: Think of each restriction as one row of \(R\); there are two equalities, so \(R\) will have two rows.
Exercise Solution
Exercise 1 Solution:\[
H_0: \begin{cases}
\mu_A - \mu_B = 0 \\
\mu_B - \mu_C = 0
\end{cases}
\] Thus, \[
R = \begin{bmatrix}1 & -1 & 0 \\ 0 & 1 & -1\end{bmatrix}, \quad c = \begin{bmatrix}0 \\ 0\end{bmatrix}
\]\(R\) has 2 rows and 3 columns, so there are \(Q=2\) restrictions.
Exercise 2 Solution:\[
R = \begin{bmatrix}1 & 1 & 0 & 0 \\ 0 & 0 & 1 & -1\end{bmatrix}, \quad c = \begin{bmatrix}0 \\ 0\end{bmatrix}
\] There are \(Q=2\) restrictions.
Summary & Reflection
The Wald test extends single-parameter testing to joint restrictions.
It controls the overall significance level when testing multiple equalities.
\(H_0: R\theta = c\) implies all restrictions hold; \(H_1\) means at least one fails.
Under \(H_0\), \(W \sim \chi^2_Q\) approximately.
Case
Null Hypothesis
Test Statistic
Distribution
One restriction
\(H_0: \theta = c\)
t or z
Normal / t
Multiple restrictions
\(H_0: R\theta = c\)
\(W\)
\(\chi^2_Q\)
Tip
Exit Question:
Why is it misleading to test each equality separately when we are interested in all of them together?
Why is it misleading to test each equality separately when we are interested in all of them together?
Testing each equality at level \(\alpha\)inflates the overall Type I error rate: \[P(\text{at least one false rejection}) \approx 1 - (1 - \alpha)^Q\]
For example, with \(Q = 3\) and \(\alpha = 0.05\), the overall error rate ≈ 14.2%.
Separate tests ignore correlations among estimates, while the Wald test accounts for their joint covariance.
The joint test evaluates whether all restrictions hold simultaneously, providing a single coherent decision.
Intuition: testing each equality separately checks individual trees; the Wald test examines the entire forest.