Sampling Distribution
Week 10
Oct 20, 2025
Final project: Data resources
Data criteria: At least 500 observations, At least 10 columns, such that at least 6 of the columns are useful and unique predictor variables. At least one variable as a reasonable outcome variable, must be quantitative (numeric).
Submit your group Github repo on Canvas (then upload research-topic.qmd on this repo), at this point you can have more than one ideas, I’ll give comment for each group about feasibility.
Plan
In today’s lecture, we will learn about:
- Sampling distribution
- Sampling distribution of sample mean and sample variance
- Law of Large Numbers
- Central Limit Theorem
Textbook Reference: JA 12,13; SDG 8
(Population) parameter and (sample) statistics
A parameter is a numerical descriptive measure of a population Because it is based on all the observations in the population, its value is almost always unknown
A sample statistic is a numerical descriptive measure of a sample It is calculated from the observations in the sample (known)
Goal: “Use sample statistic to estimate population parameter”
(Population) parameter and (sample) statistics
| Parameter | Statistics | |
|---|---|---|
| Mean | \(\mu\) | \(\bar{x}\) |
| Median | \(\tau_{0.5}\) | \(\tilde{x}_{0.5}\) |
| Variance | \(\sigma^2\) | \(s_x^2\) |
| Standard Deviation | \(\sigma\) | \(s_x\) |
| Binomial proportion | \(p\) | \(\hat{p}\) |
Random sampling
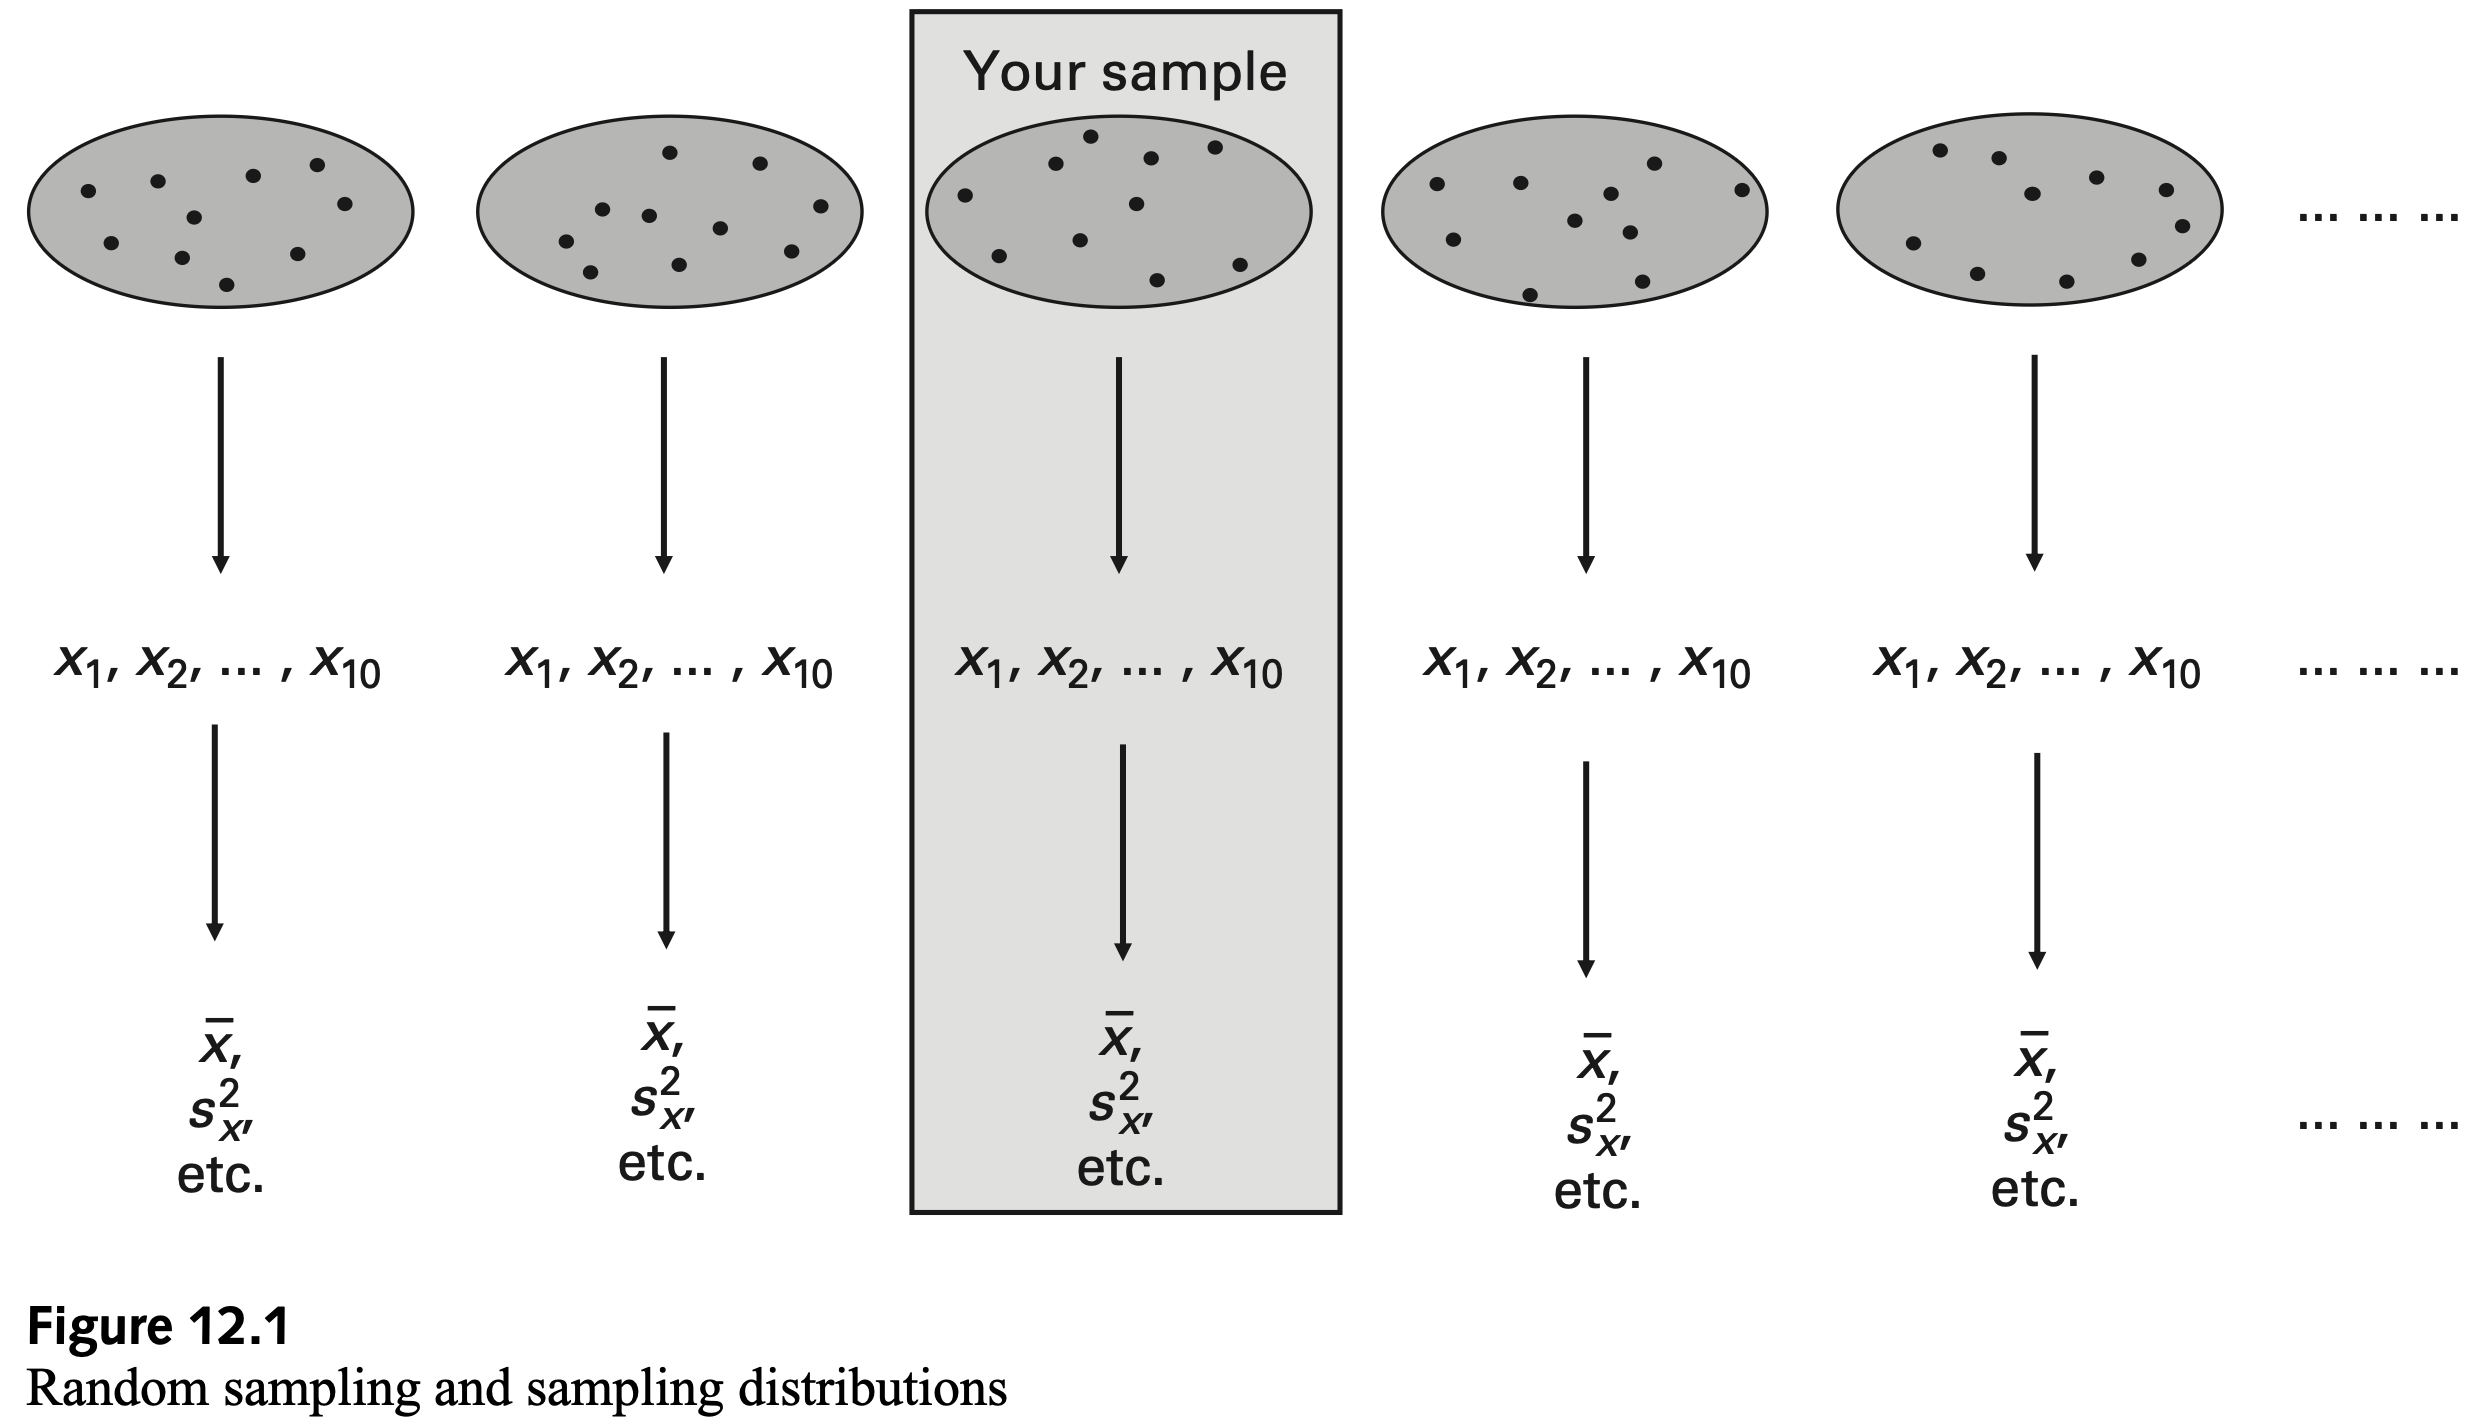
Sampling distribution
The sampling distribution of a sample statistic is the probability distribution of the statistic over all possible random samples of size \(n\) from the population
- Random variables takes different value with different probability \(\rightarrow\) probability distribution
- Since samples are random, if we repeat sampling many times, we will find that sample statistics have various values with probability \(\rightarrow\) sampling distribution
- Chapter 12 focus on case where \(n\) is fixed but we know the underlying population distribution
- Chapter 13 extend the case where \(n\) is large, which has asymptotically normal distribution sampling distribution
Sampling distribution
Suppose that the random variables \(X = (X_1, \ldots , X_n)\) form a random sample from a distribution involving a parameter \(\theta\) whose value is unknown.
Let \(T\) be a function of \(X\) and possibly \(\theta\). That is, \(T = r(X_1,\ldots , X_n, \theta)\). The distribution of \(T\) (given \(θ\)) is called the sampling distribution of \(T\).
Sampling distribution of sample mean
If \(X_1,\ldots,X_n\) are i.i.d. \(N(\mu,\sigma^2)\) random variables, the sampling distribution of \(\bar{X}\) is
\[\bar{X}\sim N\left(\mu,\frac{\sigma^2}{n}\right).\]
Sampling distribution of sample variance
If \(X_1,\ldots,X_n\) are i.i.d. \(N(\mu,\sigma^2)\) random variables, the sampling distribution of \(s_X^2\) is characterized by
\[(n-1)\frac{s_X^2}{\sigma^2}\sim \chi_{n-1}^2.\]
Example: C12P6
Consider i.i.d. random variables \(X_1,\ldots,X_n\) drawn from \(N(\mu,4)\) distribution.
For \(n=10\), what is \(P(|X−\mu|<0.1)\)
Example: C12P7
In the population, IQ scores are normally distributed with a mean of 100 and a standard deviation of 15. You intend to obtain IQ scores for a random sample of 20 individuals, from which you will calculate the sample average and the sample standard deviation.
For a single individual, what is the probability that the IQ score is greater than 105?
Example: C12P7
In the population, IQ scores are normally distributed with a mean of 100 and a standard deviation of 15. You intend to obtain IQ scores for a random sample of 20 individuals, from which you will calculate the sample average and the sample standard deviation.
For a sample of 20 individuals, what is the probability that the sample average is greater than 105?
Example: C12P7
In the population, IQ scores are normally distributed with a mean of 100 and a standard deviation of 15. You intend to obtain IQ scores for a random sample of 20 individuals, from which you will calculate the sample average and the sample standard deviation.
For a sample of 20 individuals, provide an 80% probability interval for the sample standard deviation. That is, what are the values \(a\) and \(b\) satisfying \(P(s_X<a)=0.1\) and \(P(s_X>b)=0.1\) so \(P(a\leq s_X \leq b)=0.8\)?
Law of Large Numbers
If \(X_1,\ldots,X_n\) are i.i.d. random variables with population mean \(\mu_X\), the sample mean \(\bar{X}\) gets arbitrarily close to \(\mu_X\) as \(n\) gets larger:
\[\bar{X}=\frac{\sum_{i=1}^N X_i}{n}\underset{p}{\rightarrow} \mu_X \quad \text{ as } n\rightarrow\infty.\]
Central Limit Theorem (CLT)
If \(X_1,\ldots,X_n\) are i.i.d. random variables with finite population mean \(\mu_X\) and finite population variance \(\sigma_X^2\), then for sufficiently large \(n\) then
\[\bar{X}\overset{a}{\sim} N\left(\mu_X,\frac{\sigma_X^2}{n}\right).\]
in english: asymptotically distributed as normal.
Question: How large \(n\) should be for this to hold?
Depends on underlying distribution of r.v.: See page JA pp 394
Standardized version of CLT
If \(X_1,\ldots,X_n\) are i.i.d. random variables with finite population mean \(\mu_X\) and finite population variance \(\sigma_X^2\), then for sufficiently large \(n\) then
\[\frac{\bar{X}-\mu_X}{\sigma_X/\sqrt{n}}\overset{a}{\sim} N\left(0,1\right).\]
such that \(P(\bar{X}<x)=\Phi\left(\frac{x-\mu_X}{\sigma_X/\sqrt{n}}\right)\) where \(\Phi\) is the cdf of standard normal.
Normal approximation for binomial
If \(X_1,\ldots,X_n\) are i.i.d. random variables with \(X\sim\text{Binomial}(n,\pi)\), then by CLT,
\[\bar{X}\overset{a}{\sim}N\left(\pi,\frac{\pi(1-\pi)}{n}\right)\]
For random variable \(Y=X_1+\ldots+X_n\), then by CLT, \[Y=n\bar{X}\overset{a}{\sim}N\left(n\pi,n\pi(1-\pi)\right)\]
Example: C13P6
For a random sample of 400 unemployed workers drawn from the population,the duration of unemployment (in weeks) for each worker is an i.i.d.draw of a random variable \(X\).
If \(P(\bar{X}>21)=0.5\), what is \(E(X)\)?
Example: C13P6
For a random sample of 400 unemployed workers drawn from the population,the duration of unemployment (in weeks) for each worker is an i.i.d.draw of a random variable \(X\).
If \(E(X)=20.7\) and \(\sigma_X =11.2\), what is \(P(X >21)\)?
Example: C13P6
For a random sample of 400 unemployed workers drawn from the population,the duration of unemployment (in weeks) for each worker is an i.i.d.draw of a random variable \(X\).
What is \(P(X >21)\) if we increase the sample size from 400 to 1600?
Example: C13P7
Suppose that 52 weekly AQI measures are taken during the year in both Augusta, Maine and Los Angeles, California. Assume that all AQI measures are independent of each other, with Augusta’s measures i.i.d. draws from the \(Q_A\) random variable with expected value 25 and standard deviation 15 and Los Angeles’s measures i.i.d. draws from the \(Q_L\) random variable with expected value 45 and standard deviation 25.
What is the asymptotic distribution of the sample average of AQI for Augusta over 52 weeks?
Example: C13P7
Suppose that 52 weekly AQI measures are taken during the year in both Augusta, Maine and Los Angeles, California. Assume that all AQI measures are independent of each other, with Augusta’s measures i.i.d. draws from the \(Q_A\) random variable with expected value 25 and standard deviation 15 and Los Angeles’s measures i.i.d. draws from the \(Q_L\) random variable with expected value 45 and standard deviation 25.
What is the asymptotic distribution of the sample average of AQI for Los Angeles over 52 weeks?
Example: C13P7
Suppose that 52 weekly AQI measures are taken during the year in both Augusta, Maine and Los Angeles, California. Assume that all AQI measures are independent of each other, with Augusta’s measures i.i.d. draws from the \(Q_A\) random variable with expected value 25 and standard deviation 15 and Los Angeles’s measures i.i.d. draws from the \(Q_L\) random variable with expected value 45 and standard deviation 25.
What is the asymptotic distribution of the difference in sample average of AQI for Los Angeles and Augusta?
Example: C13P8
Cindy’s Cereals sells cereal in 20-ounce boxes. Its manufacturing process leads to actual weights (in ounces) that are i.i.d. draws from the random variable \(X\sim N(20, 1/900).\) Suppose that it repackages any box weighing less than 19.9 ounces.
What is the probability that any given box is repackaged?
Example: C13P8
Cindy’s Cereals sells cereal in 20-ounce boxes. Its manufacturing process leads to actual weights (in ounces) that are i.i.d. draws from the random variable \(X\sim N(20, 1/900).\) Suppose that it repackages any box weighing less than 19.9 ounces.
For a manufacturing run of 20,000 boxes, what is the approximate normal distribution of the number of boxes that are repackaged?
Summary
- Sampling distribution of sample mean is normally distributed.
- Sampling distribution of sample variance is chi-square distributed.
- By CLT sample size gets larger, the sample mean of random variables approximate normal distribution.
Up next: Estimation and confidence intervals, Research topics due Wendesday

ECON2250 Statistics for Economics - Fall 2025 - Maghfira Ramadhani