Welcome to ECON 2250!
Week 2
Aug 25, 2025
Welcome!
Meet Afi Ramadhani!
- Education and career journey
- BS and MS in Petroleum Engineering from Institute of Technology Bandung (QS Top 100 in Petroleum Engineering)
- Academic professional and consultant for think tanks in Indonesia
- MS in Economics from Georgia Tech
- PhD Candidate in Economics at Georgia Tech
- I am an energy and environmental economist interested in examining the broad impact of climate change and energy transition 🙂
- You call me Afi or Professor or Prof. Afi or Prof. Ramadhani (no Dr yet)
Meet the Teaching Assistant (TA)!
- Rohit Borah: Head TA
Short Survey
Scan the QR code to fill out the survey!
https://gatech.instructure.com/courses/482358/quizzes/717963

Topics
Introduction to the course
Syllabus activity
Reproducibility
What is Statisics?
Statistics is the branch of mathematics that deals with the collection, analysis, interpretation, presentation, and organization of data. It helps us understand and describe patterns, relationships, and trends in data, and it allows us to make informed decisions in the presence of uncertainty
Source: ChatGPT (with modification)
What is Statisics?
There are two main branches of statistics:
Descriptive Statistics – Summarizes and organizes data using measures
Inferential Statistics – Makes inference or generalizations about a population based on a sample of data.
Source: ChatGPT (with modification)
Statistics in practices
Statistics in practice: Economics
Economic measurement
GDP = C + I + G + (X - M), Unemployment rate, Inflation, Consumer Spending, Median Income, Demographics
Typical process to publish these data:
Collect data from sample of population (Census, Survey, etc),
Create a measure from processing the data and then publish data,
Economist use the data to inform policy making
Statistics in practice: Economics
Testing Economic Theory
Do men and women have the same average wage?
Do people with college degrees earn more than those without?
Does increasing minimum wage reduce employment?
Are poverty rates the same in urbal and rural areas?
Does conservation nudge reduce electricity consumption?
Statistics in practice: Data Science
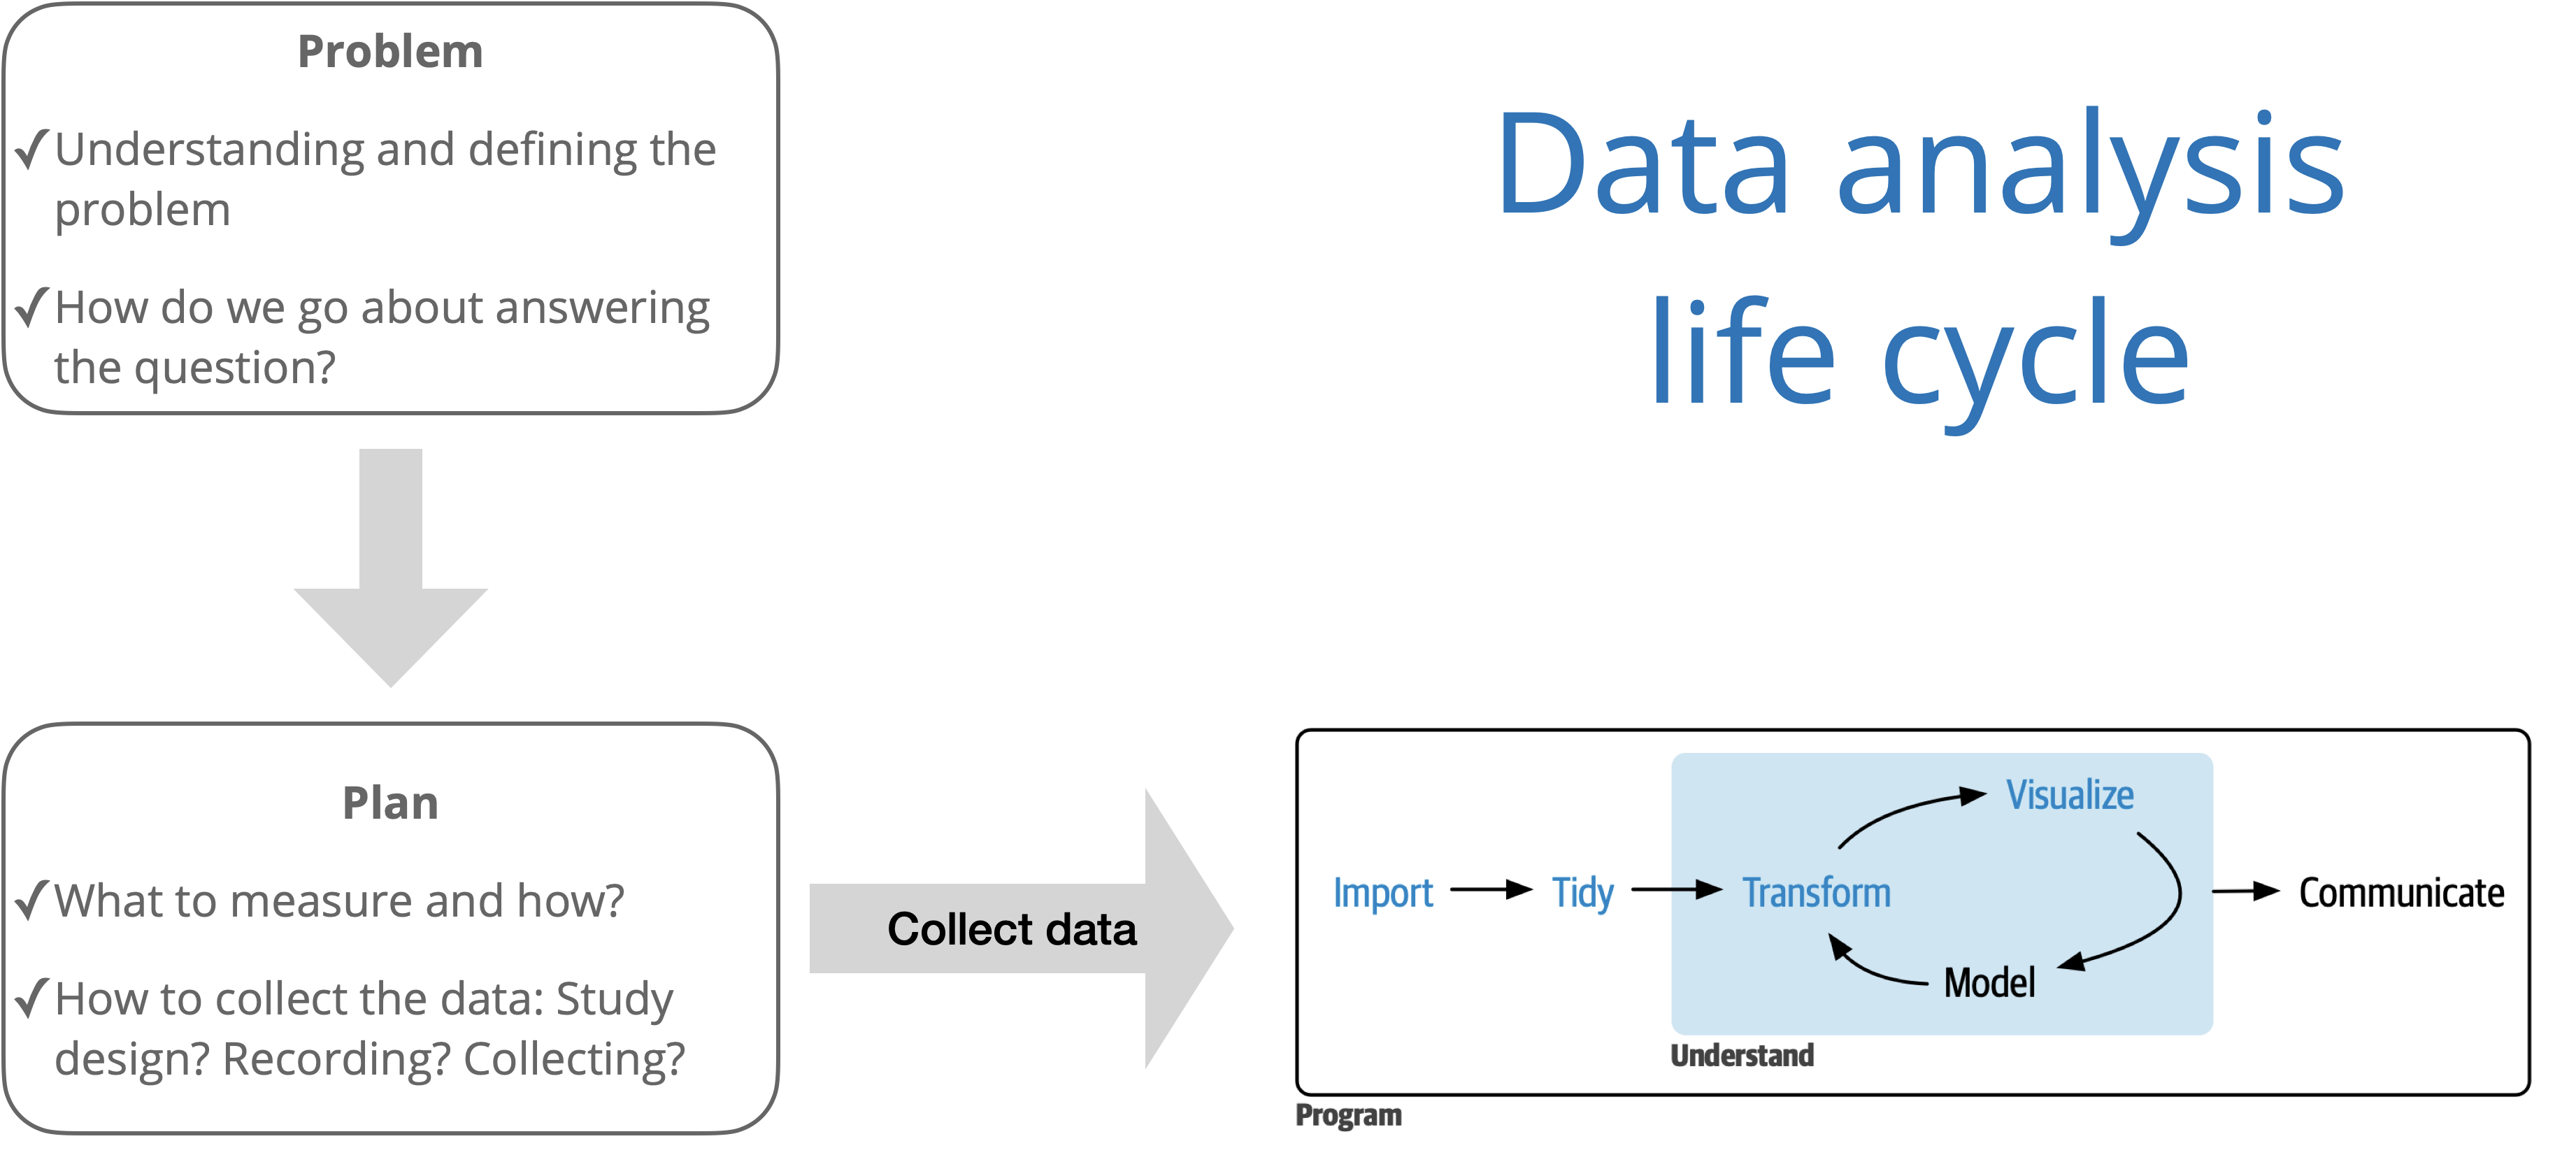
Source: R for Data Science with additions from The Art of Statistics: How to Learn from Data.
ECON2250
What is ECON2250?
MATH
Probability theory
+
DATA
Sampling and uncertainty
=
STATISTICS
Descriptive and Inference
Course goal: As student’s first statistics course, will equip students with fundamental concepts and tools for more advanced course, e.g. Econometrics, Data Science, or Machine Learning
Prerequisites: No prerequisites, but some math course are encouraged, e.g. MATH1551 and MATH1552
Course learning objectives
By the end of the semester, you will be able to…
- master the language and the fundamental concepts of probability theory.
- apply basic statistical inference techniques in empirical research settings with an understanding of their utility and limitations.
- implement a reproducible workflow using R for statistical analysis and simulation, Quarto to write reports and GitHub for version control and collaboration.
- understand data in economics/social science, including data types, data generating processes, data analysis, and how to communicate with data (data literacy).
- acquire foundation knowledge of statistical concepts to prepare for more advanced data analysis or econometrics courses.
Course topics
Probability
- Probability
- Conditional probability and independence
- Counting methods
- Random variables
- Expectation and moments
Data and Distributions
- Data and sampling
- Descriptive statistics
- Discrete random variables
- Continuous random variables
Statistical Inference
- Sampling distributions
- Estimation and confidence intervals
- Hypothesis testing
- Multiple hypothesis testing
- Simple linear regression
- Advanced topics (optional)
General topics
- Computing using R and GitHub
- Presenting statistical results
- Collaboration and teamwork
Course overview
Course toolkit
- Website: https://maghfiraer.github.io/Stats-F25
- Central hub for the course!
- Tour of the website
- Canvas: https://gatech.instructure.com/courses/482358
- Gradebook
- Office hours
- Announcements
- Gradescope
- Ed Discussion
- GitHub: https://github.com/Stats-F25
- Distribute assignments
- Platform for version control and collaboration
Hardware requirement
- Computer:
- Individual computer with the following software installed:
- R, R studio, Git and Github
- Access through the IAC VLab is available
- Individual computer with the following software installed:
- Textbook:
- Schervish, Mark J., and Morris H. DeGroot (SDG). Probability and Statistics, 4th Edition.
- Jason Abrevaya (JA). Probability and Statistics for Economics and Business An Introduction Using R
Computing toolkit

All analyses using R, a statistical programming language
Write reproducible reports in Quarto
Access RStudio through IAC VLab

Access assignments
Facilitates version control and collaboration
All work in Stats-F25 course organization (tentative)
Classroom community
It is my intent that students from all diverse backgrounds and perspectives be well-served by this course, that students’ learning needs be addressed both in and out of class, and that the diversity that the students bring to this class be viewed as a resource, strength and benefit.
If you have a name that differs from those that appear in your official Tech records, please let me know.
Please let me know your preferred pronouns, if you are comfortable sharing.
If you feel like your performance in the class is being impacted by your experiences outside of class, please don’t hesitate to come and talk with me. If you prefer to speak with someone outside of the course, your advisers and deans are excellent resources.
I (like many people) am still in the process of learning about diverse perspectives and identities. If something was said or done in class (by anyone) that made you feel uncomfortable, please talk to me about it.
Accessibility
The Office of Disability Services (ODS) is available to ensure that students are able to engage with their courses and related assignments.
If you have documented accommodations from ODS, please send the documentation as soon as possible.
I am committed to making all course activities and materials accessible. If any course component is not accessible to you in any way, please don’t hesitate to let me know.
Syllabus activity
- Read the portion of the syllabus assigned to your group.
- Discuss the key points and questions you my have with your neighbors.
- We’ll ask for volunteers to share a summary with the class.
Syllabus activity assignments
Group 1: What to expect in lectures and labs
Group 2: Homework and lab assignments
Group 3: Exams and project
Group 4: Participation
Group 5: Academic honesty (except AI policy)
Group 6: Artificial intelligence policy
Group 8: Late work and regrade request
Syllabus activity report out
Group 1: What to expect in lectures and labs
Group 2: Homework and lab assignments
Group 3: Exams and project
Group 4: Participation
Group 5: Academic honesty (except AI policy)
Group 6: Artificial intelligence policy
Group 8: Late work and regrade request
Grading
| Category | Percentage |
|---|---|
| Homework | 15% |
| Final project | 20% |
| Lab | 15% |
| Exams (2 midterms) | 40% |
| Participation (AEs + Teamwork) | 10% |
| Total | 100% |
Five tips for success in ECON2250
Complete all the preparation work before class.
Ask questions in class, office hours, and on Ed Discussion.
Do the homework and labs; get started on homework early when possible.
Don’t procrastinate and don’t let a week pass by with lingering questions.
Stay up-to-date on announcements on Ed Discussion and sent via email.
Questions?
Before next class
Complete JA Chapter 4
Review the updated syllabus
Office hours start today, Monday, August 25 (5-6pm)
Reference

ECON2250 Statistics for Economics - Fall 2025 - Maghfira Ramadhani